AI in planning only delivers value when it is embedded in the process. But you cannot understand a process from a distance. That is why we go and see it for ourselves.
Many AI projects in supply chain planning begin with a software tool. We begin at the planner’s desk. In the Toyota Production System, this principle is known as Genchi Genbutsu: go and see the real thing. The problems that never appear in a requirements document become visible where the work actually happens.
We recently spent a day working alongside a planner at an industrial company as “planning interns.” We did not give a presentation or demonstrate a tool. We watched, pitched in, and asked questions.
We brought two questions that cannot be answered from a distance: How do planners actually use our demand forecasts? And what do they still do manually afterwards?
What the forecast does not know
A statistical forecast answers one question: What is the market likely to demand? The planner has to answer a different one: What should we plan so that it works for production, customers, and the business?
Between the two lie business constraints that do not appear in any time series. Two stood out particularly clearly that day: production capacity and service levels.
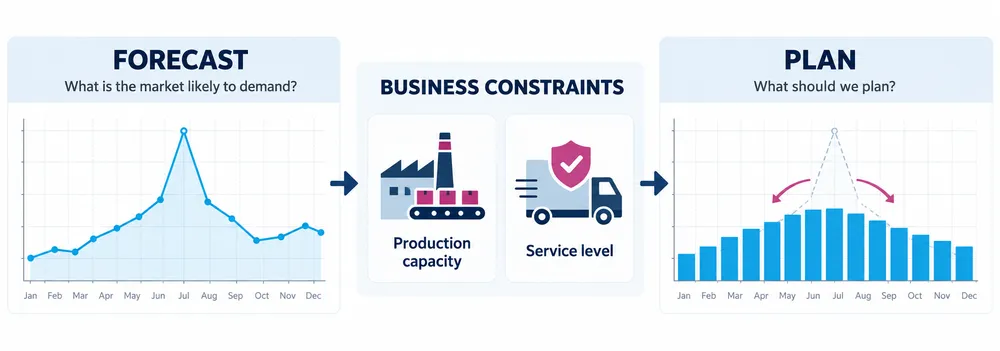
The spike that never reaches production
The statistical forecast is sound. For one of the coming months, it shows a clear spike in demand. That is exactly what it should do: the demand forecast reflects what the market is likely to require.
But the planner does not simply pass that number on. In a separate calculation, he converts the unit volumes into working hours at the bottleneck workstation. The result: the spike exceeds capacity. So he spreads the volume across the preceding weeks and checks whether the required quantities will be available on time. Only then does he approve the plan. The figure he passes on differs from the forecast – and rightly so.
The rule behind this is simple: production peaks should be avoided wherever possible. Otherwise, someone from production will soon be standing at the planner’s desk.
What happens here is more than a calculation. The planner creates consensus between what the market demands and what production can deliver. He does so manually, over and over again in every planning cycle.
Service level is everything
A good forecast will sometimes be slightly too high and sometimes slightly too low. Common error metrics such as MAPE penalize both equally.
For the planner, however, these errors are not equivalent. If the plan is slightly too high, the goods remain in stock for a few extra weeks. It comes at a cost, but it is manageable. If it is too low, a customer who was promised availability has to wait. That can cost an order and, in the worst case, a customer.
The planner may therefore deliberately plan above the forecast, especially for items with long lead times and customers whose ordering behavior is becoming increasingly difficult to predict. The question he asks is: “Have I left enough buffer for item X in case that unexpected order comes in next week after all?”
Measured by MAPE, that adjustment is an error. For the business, it is the right decision. If you measure forecasts by MAPE alone, you risk optimizing the metric rather than the business.
The manual work after the forecast
That day gave us answers to both of our questions. For the planner, the forecast is the starting point, not the final result. The forecasts we provide are good. But once the forecast was ready, the planner’s real work had only just begun: he adjusted it manually, smoothed peaks, added buffers, and checked everything against capacity and delivery commitments. In every planning cycle. These decisions follow rules and trade-offs that are not documented in any requirements specification. They are so self-evident to planners that hardly anyone mentions them. You only notice them when you sit beside a planner for a day and join in their work.
What we are building from these insights
These observations are now shaping the building blocks of our solution. We deliberately do not incorporate capacity and service-level considerations into the forecast itself. The forecast should provide an honest view of what the market demands. Otherwise, no one can see the true level of demand – or determine whether investing in additional capacity would be worthwhile.
Both belong directly after the forecast as a separate, visible step:
- Capacity: The solution converts the forecast into hours at the bottleneck, flags peaks, and suggests how they can be smoothed, including the implications for inventory and materials.
- Service level: In addition to MAPE, we use metrics such as SPEC, which weight stockout and holding costs separately depending on whether service level or inventory reduction is the current priority. Buffers are set deliberately for each customer and material, and their costs remain visible.
The planner remains in control. The solution takes over the manual work that follows the forecast.
Why we work this way
A tool that does not fit the process helps no one, no matter how well it calculates. That is why we work in three steps:
- Understand day-to-day planning. We listen – ideally on site and together with the people who plan every day.
- Identify opportunities for improvement. We show which changes offer the greatest value and where it makes sense to begin.
- Implement. We build the solution to fit the company’s processes and systems.
Understand first, then act. That is how AI becomes part of everyday work.
Where does your planning, forecasting, or S&OP process get stuck? We listen and show you specific opportunities for improvement.